Deleted
Deleted Member
Posts: 0
|
Post by Deleted on Jan 11, 2015 22:15:03 GMT
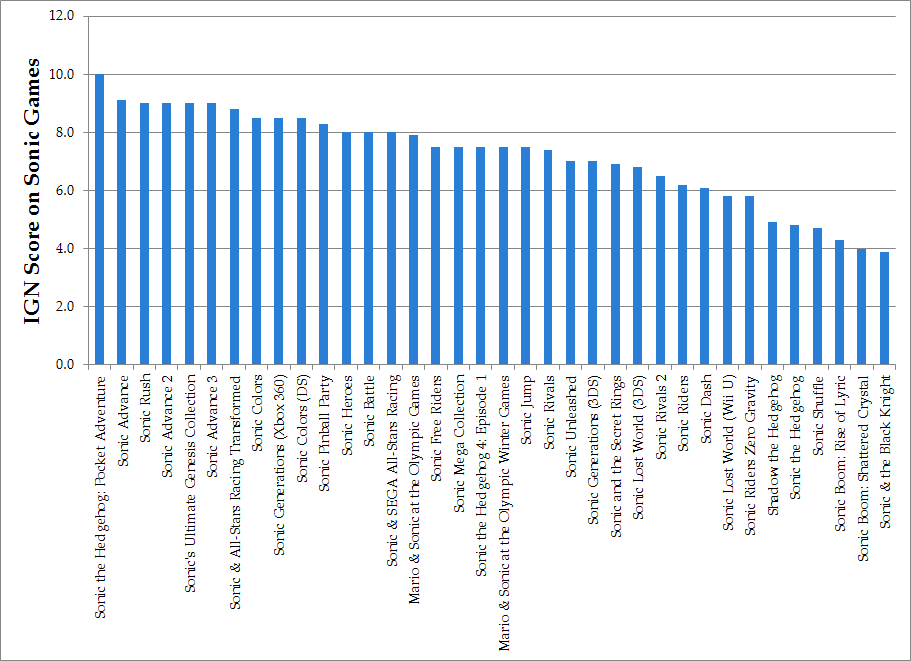
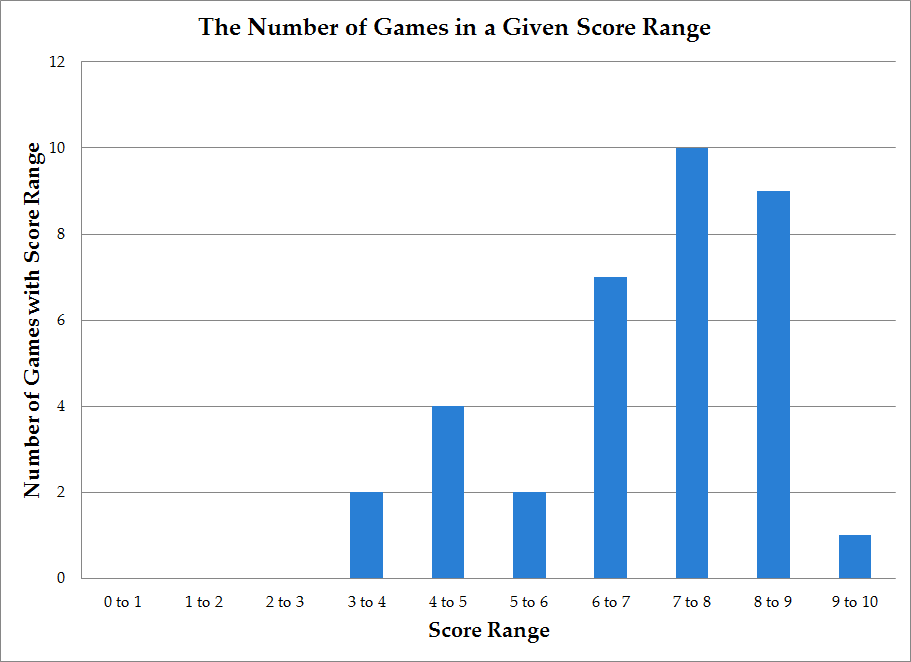
So I said that I would have something big to talk about, and here is what I have.  This chart is of all the Sonic the Hedgehog Video Games that have been reviewed by IGN.  This chart is how many games reviewed fall into a score range. For example, 7.5 would be in 6 to 7, and 7 would be in 6 to 7, but 7 would not be in 7 to 8.  This final chart is probably the most important. It is a timeline of IGN ratings from 1999-2014. The trend line suggests that the average rating is lowering as the years go on. Some more information on the data I collected is that Sonic games have an average IGN rating of 7.2 and a standard deviation of 1.581. |
|
STP
E Rank

Posts: 133 
|
Post by STP on Jan 12, 2015 19:04:00 GMT
I can't believe I missed seeing this yesterday. I certainly have something to say about it.
Just to clarify, did you perform this analysis yourself, or was it performed by IGN or some other authoritative source? In any case, it's never crossed my mind to break down the IGN ratings of different Sonic games and try to establish trends, although it is nice to see some hard numbers to back up the downhill trend people have long been claiming is occurring.
With a standard deviation spanning almost 16% of the possible data values (0 to 10) and a staggering 26% of the data extremes (3.9 to 10.0), it's way too broad of a scatter to be definitive proof of anything. And this graph is also misleading in that it implies that all the games were developed by the very same people with the very same company, and that's not the case (take the new Sonic Boom games, for instance). The drastic fluctuation between scores of different games in consecutive years also suggests that some game ideas just happen to make it big and others don't. Compare that with other varieties of video games, like the GTA series that has the same core premise every time but continues improving with better graphics, bigger play field, more variety in activities, etc.
|
|
Deleted
Deleted Member
Posts: 0
|
Post by Deleted on Jan 12, 2015 23:42:05 GMT
Oh I agree with you. The trend line is not very representative of any true trend. The data is way to scattered to make a proper estimation of any game coming in the new years, but there does seem to be more values up and then down and then up and now back to down. I estimate that it has a non-linear relationship if I was to look at the residual plot.
I did gather all the data and made the charts and calculations myself.
And to your thinking of the graph being misleading, this is somewhat true. I was only looking at year game released to explain score. If i was to look at developers or consoles the games were released on, I might see a different trend.
What my friend suggested is that I include scores from Metacritic and other video game journalism sites and see if that strengthens or weakens the relationship.
|
|
STP
E Rank

Posts: 133 
|
Post by STP on Jan 13, 2015 3:56:42 GMT
What my friend suggested is that I include scores from Metacritic and other video game journalism sites and see if that strengthens or weakens the relationship. That actually sounds like a smart idea. The more professional opinions you take into account, the more balanced the result will be. What you might want to do is revise each data point in all your charts so that the score is the average of all the sources you find (and of course, list them all). |
|
Deleted
Deleted Member
Posts: 0
|
Post by Deleted on Jan 16, 2015 1:51:27 GMT
What my friend suggested is that I include scores from Metacritic and other video game journalism sites and see if that strengthens or weakens the relationship. That actually sounds like a smart idea. The more professional opinions you take into account, the more balanced the result will be. What you might want to do is revise each data point in all your charts so that the score is the average of all the sources you find (and of course, list them all). The only issue I can think of right now is that not all journalists will have reviews for the same game. I can convert a 5 scale into a 10 scale and vice-versa, but if they don't have all the same games, it could be an issue and lead to bias. |
|
STP
E Rank

Posts: 133 
|
Post by STP on Jan 16, 2015 14:26:24 GMT
That actually sounds like a smart idea. The more professional opinions you take into account, the more balanced the result will be. What you might want to do is revise each data point in all your charts so that the score is the average of all the sources you find (and of course, list them all). The only issue I can think of right now is that not all journalists will have reviews for the same game. I can convert a 5 scale into a 10 scale and vice-versa, but if they don't have all the same games, it could be an issue and lead to bias. Then you can show your sources by showing a table, with game titles in the rows, rating sources in the columns, and an "X" mark to indicate whether or not certain sources have information on certain games. |
|